Table of Contents
Scientific Visualization 101: Amira & Avizo - An Introductory Hands-On Workshop
Date
- Sunday January 26, 2025
- 1:30pm - 3:30pm
Venue
- Building 1, Level 2, Room 2418
Organizer
Thomas Theußl
Visualization Core Laboratory
thomas.theussl@kaust.edu.sa
Register
Workshop Materials
- Previously recorded workshop on youtube
- Slides: slides.pdf
- Dataset: dataset.zip
How to Prepare?
- Review and download the workshop materials
- Bring a laptop (Linux/Windows) with Avizo/Amira installed (download from here).
Overview
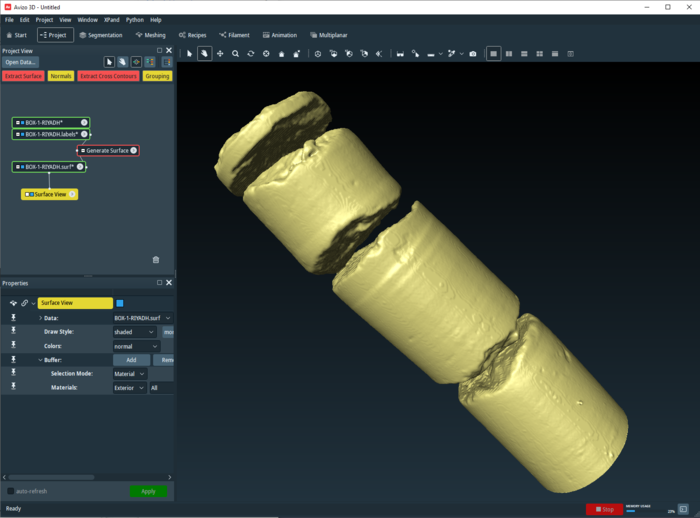
Visualization experts from the laboratory will introduce Avizo/Amira - a general-purpose commercial software application for scientific data visualization and analysis. Avizo/Amira users can quickly build visualizations to analyze their data using qualitative and quantitative techniques. The data exploration can be done interactively in 3D on a Desktop. Attendees will participate in hands-on sessions working with Avizo/Amira to create 3D visualizations of scientific datasets.
Who Should Attend?
The target audience for this workshop are KAUST users who are looking for a new scientific visualization solution and have little or no experience with Avizo/Amira or scientific visualization in general.
Agenda
| Time | Topic | Speaker |
|---|---|---|
| ~10 min | Introduction | Thomas Theußl |
| ~30 min | Scientific Visualization: Scalar Fields | Thomas Theußl |
| 5 - 10 min | — break — | - |
| ~30 min | Scientific Visualization: Volume Segmentation | Thomas Theußl |
| 5 - 10 min | — break — | - |
| 20 min | The Avizo GUI and Features | Thomas Theußl |
| on demand | Q&A / Discussion | all |
Useful Resources
- Official Avizo Software for Materials Science site
- Xtra Library for Thermo Scientific Amira, Avizo and PerGeos Software (incuding demo videos)
- Amira-Avizo Learning Center by Thermo Scientific EM & Spectroscopy on youtube
- Avizo Software demo videos by Thermo Scientific EM & Spectroscopy on youtube
- How to use Avizo by Sam Schickler on youtube
