Visualizing Extreme Weather Events from the WRF Simulation
KVL Staff on Project
![]() James Kress
James Kress
![]() james.kress@kaust.edu.sa
james.kress@kaust.edu.sa
![]() Thomas Theußl
Thomas Theußl
![]() thomas.theussl@kaust.edu.sa
thomas.theussl@kaust.edu.sa
![]() Visualization Core Laboratory
Visualization Core Laboratory
Overview
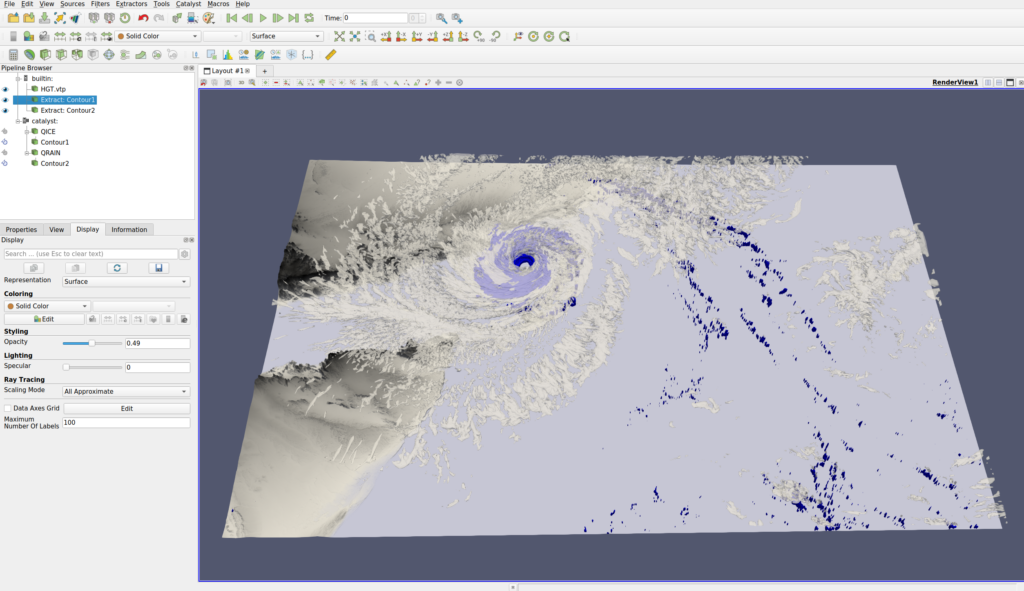
KVL and Kitware collaborated to create a blog post showcasing the use of ParaView Catalyst for in situ visualization.
In situ visualization provides a snapshot of a simulation that is running on a supercomputer. This gives researchers the chance to verify that the simulation is operating properly before executing to completion, much like checking a map to confirm you are on the right road before arriving at your final destination. However, the implementation of in situ simulations is demanding, so much so that scientists are hesitant to use it.
One in situ implementation that has been working on making in situ less demanding to implement, is ParaView Catalyst. This library allows simulation codes to implement a small number of methods from the Catalyst API, which instantly enables them to use the full power of ParaView Python pipelines to perform visualization and analysis.
For more information see the Kitware blog post: https://www.kitware.com/cyclone-chapala-simulation-with-paraview-catalyst-through-kaust-imshimtu-library/