Scientific Visualization 101: ParaView ~ An Introductory Hands-On Workshop
Date
- Tuesday October 1, 2024
- 1:30pm - 3pm
Venue
- Building 1, Level 2, Room 2418 (Desert Side)
Organizer
Thomas Theußl
Visualization Core Laboratory
thomas.theussl@kaust.edu.sa
Register
Workshop Materials
- Slides: slides.pdf
- Data: datasets.zip
- Previously recorded YouTube video
How to Prepare?
- Review and download the workshop materials
- Bring a laptop with ParaView installed
- The latest version of ParaView (currently 5.13) is recommended for the workshop. You can download it from here.
Overview
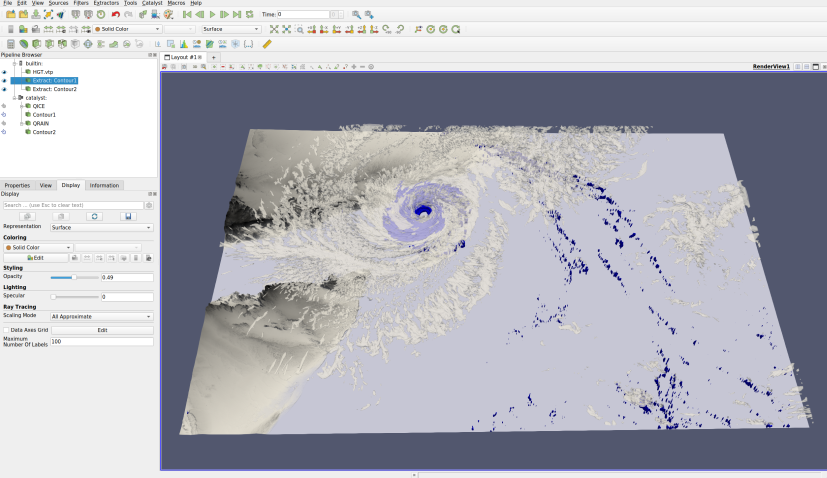
Visualization experts from the laboratory will introduce ParaView, an open source post-processing visualization application for visualizing and analyzing data quickly and interactively in 3D.
Who Should Attend?
The target audience for this workshop are KAUST users with little or no experience with ParaView.
Agenda
| Time | Topic | Speaker |
|---|---|---|
| ~10 min | Introduction | Thomas Theußl |
| ~30 min | Scientific Visualization: Scalar Fields | Thomas Theußl |
| ~5 min | — break — | - |
| ~30 min | Scientific Visualization: Vector Fields | Thomas Theußl |
| ~15 min | The ParaView GUI and Features | Thomas Theußl |
| on demand | Q&A / Discussion | all |
