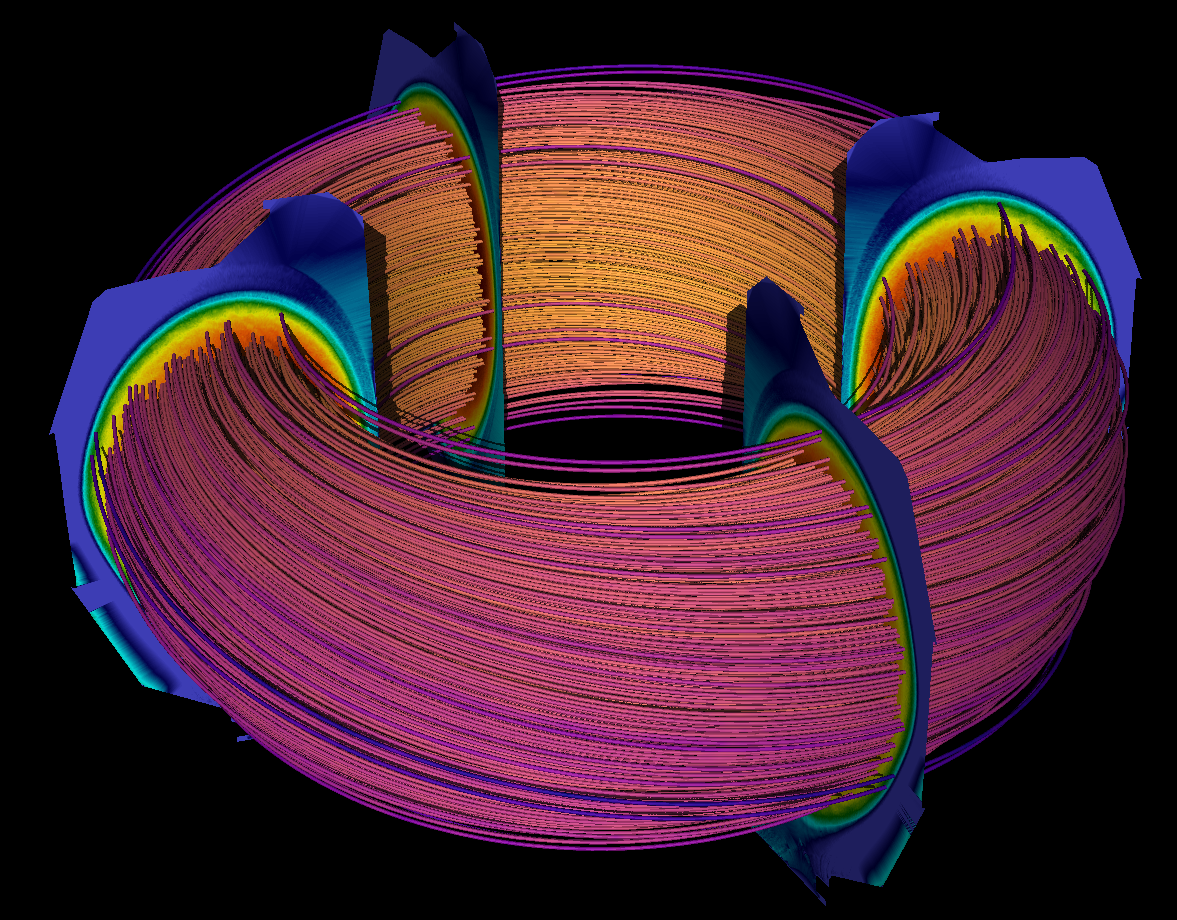
Scientific Visualization 101: Visit ~ An Introductory Hands-On Workshop
Date
- Tuesday September 17, 2024
- 1:30pm - 3:30pm
Venue
- Building 1, Level 2, Room 2418
Organizer
James Kress
Visualization Core Laboratory
james.kress@kaust.edu.sa
Register
Workshop Materials
- Slides: Slides
- Datasets: Data 1, Gray-Scott Data
How to Prepare?
- Review and download the workshop materials
- Bring a laptop with VisIt installed
- VisIt version 3.3.0 or newer is required for the workshop. You can download it from https://visit-dav.github.io/visit-website/releases-as-tables/#latest.
Overview
Visualization experts from the laboratory will introduce VisIt- a highly-scalable, open-source, multi-platform data analysis and visualization application. VisIt users can quickly build visualizations to analyze their data using qualitative and quantitative techniques. The data exploration can be done interactively in 3D. Attendees will participate in a hands-on session working with VisIt to create 3D visualizations of scientific datasets.
VisIt is an essential tool for scientific visualization, especially for large datasets. It is professional-quality, user-friendly software that is packed with advanced functionality. It was developed to analyze extremely large datasets (using distributed memory and parallel computing resources); but, its special super-power is that it grows with the user's data, running great on the laptop, the workstation, the cluster (Ibex), and the supercomputer (Shaheen). Visualization and analytic pipelines created in VisIt at the start of your project will continue to work efficiently even as the amount of data produced continues to grow.
Join us to learn how to prepare data, automate visualizations, and scale your analysis from workstation to cluster to supercomputer.
Who Should Attend?
The target audience for this workshop are KAUST and In-Kingdom users who are looking for a new scientific visualization solution and have little or no experience with VisIt or scientific visualization in general.
Agenda
| Time | Topic | Speaker |
|---|---|---|
| 1:30pm - 1:40pm | Welcome | James Kress |
| 1:40pm - 1:50pm | Introduction to Scientific Visualization and the VisIt GUI | James Kress |
| 1:50pm - 2:00pm | Coffee Break – Download VisIt & data files | |
| 2:00pm - 2:15pm | Hands-On Session 1: GUI Tour | James Kress |
| 2:15pm - 2:45pm | Hands-On Session 2: basic plots | James Kress |
| 2:45pm - 3:00pm | Coffee Break | |
| 3:00pm - 3:30pm | Hands-On Session 3: screenshots / movies animations / & more | James Kress |
| 3:30pm | Q&A | James Kress |
